Click to open the Profile page
Click to open the Devices page
Click to open the Map page
Click to open the Alerts page
Click to open the Reporting page
Click to open the Downloads page
Click to open the Support page
Click to open the Subscription page
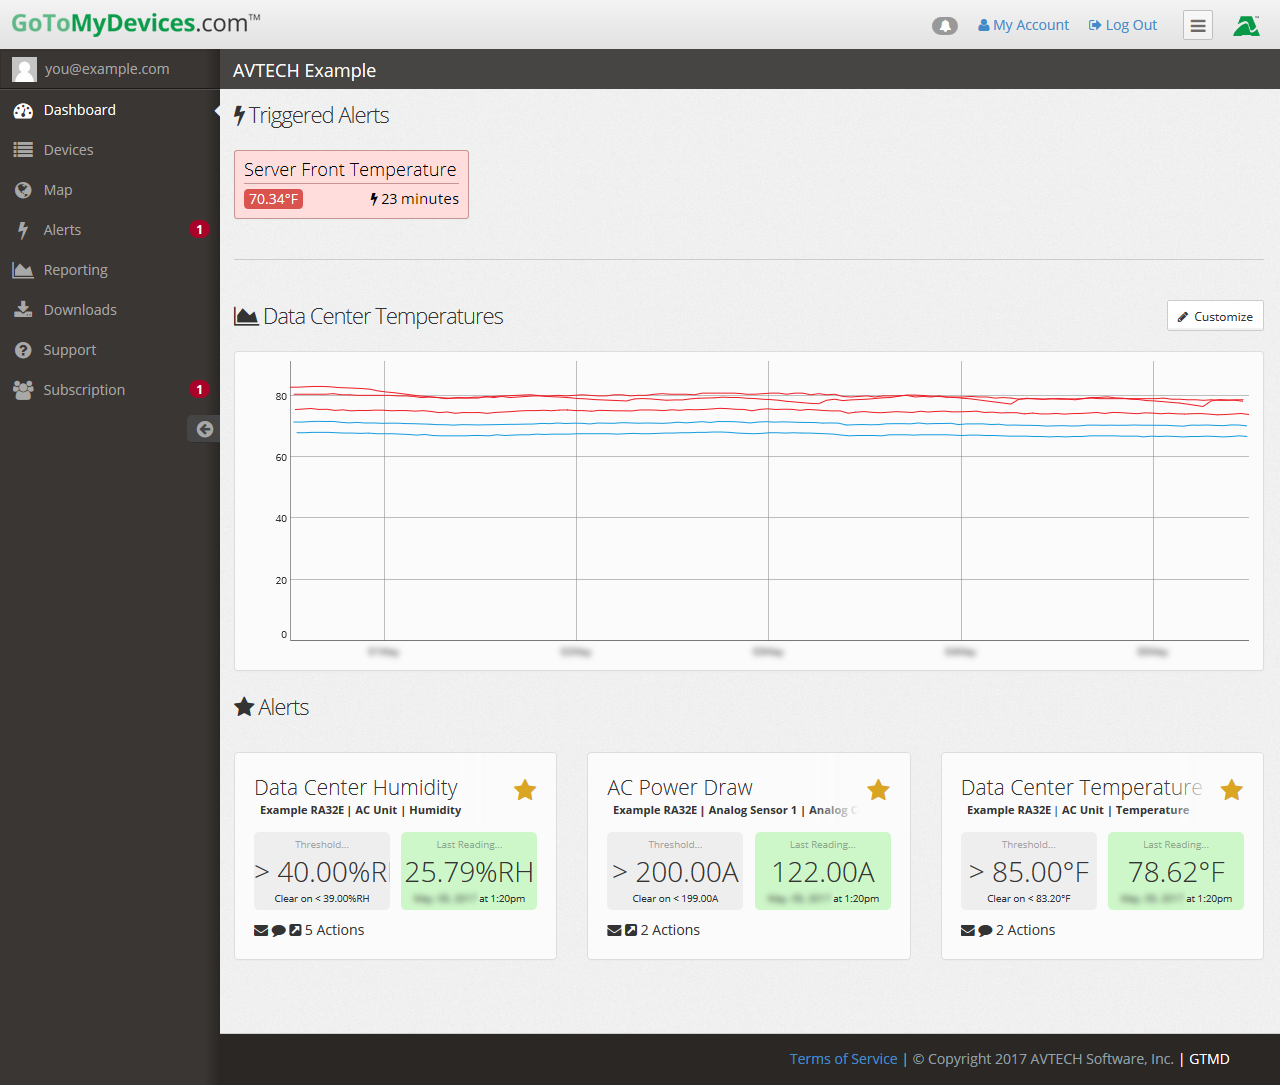
Watch For Triggered Alerts
Any alerts that are currently in an alarm state appear at the top of your dashboard so you can quickly view the current sensor reading and the amount of time that the alert has been triggered.
Customize The Dashboard
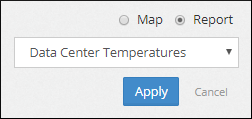
The Customize button allows you to switch to map view or choose a different report.
Monitor Graphed Sensor Data Or Mapped Devices
This section of the dashboard can either display a map of your devices or one of your sensor data reports—it's up to you!
GoToMyDevices automatically updates the dashboard at a 5 minute interval, so you may choose to leave the dashboard open on screen to view constant trends in your environment.
Bookmark Your Alerts
Pin the alerts that are most important to you directly to your dashboard.