Knowledge Base / Frequently Asked Questions / Room Alert Monitors (PRO, MAX, and Legacy)
Using an older version of the Room Alert Monitor web interface? Please click here for the appropriate FAQ.
The tracing feature is a very useful tool that can be used to assist in troubleshooting issues with your Room Alert Monitor.

You may check to make sure trace is enabled by following the steps below.
Please note that trace is enabled by default on all Room Alert ‘S’ models. As of Room Alert 32E & 12E firmware version 3.0.1, Room Alert 4E firmware version 4.0.1 and Room Alert 3E firmware version 2.0.1, trace is enabled by default.
1. Open your Room Alert Monitor’s web interface. You may open the interface using Device Discovery, Device ManageR, or your account at RoomAlert.com. You may also type the IP address of the unit directly into the address bar of your web browser.
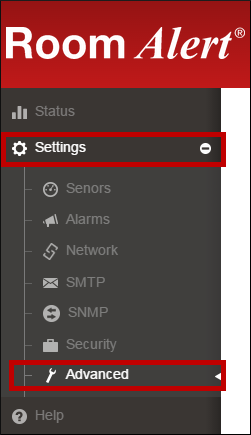
2. Select Settings in the navigation bar to the left.
3. Then select Advanced from the options below Settings.
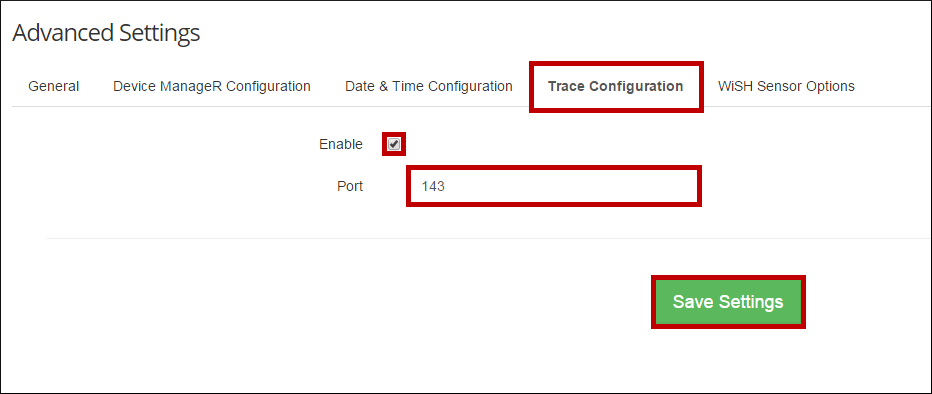
4. Navigate to the Trace Configuration section of the Advanced Settings page.
5. In Trace Configuration:
– Check that the Enable check box is selected. If it is not, select this box.
– Typically, leave Port at the default, 143. You do not need to change this port unless you know port 143 is blocked by your network.
6. Select Save Settings at the top or bottom of the screen. Your Room Alert Monitor will reboot with your new settings.
7. Next, go to Step 2 to generate the trace.
Select one of the methods below to capture a trace from your Room Alert Monitor.
* Using Windows Command Prompt is the preferred method. Our Technical Support Team is most familiar with this method.
You must have Telnet enabled on your Windows system in order to complete the steps below. Telnet is disabled by default in Windows versions Vista and above. Please see our FAQ How To Enable Telnet In Windows (Versions Vista And Above) for help.
1. Open Windows Command Prompt as an administrator.
2. At the prompt, enter the following command:
telnet <IP address of your Room Alert unit> <trace port number> -f c:\tracefile.txt
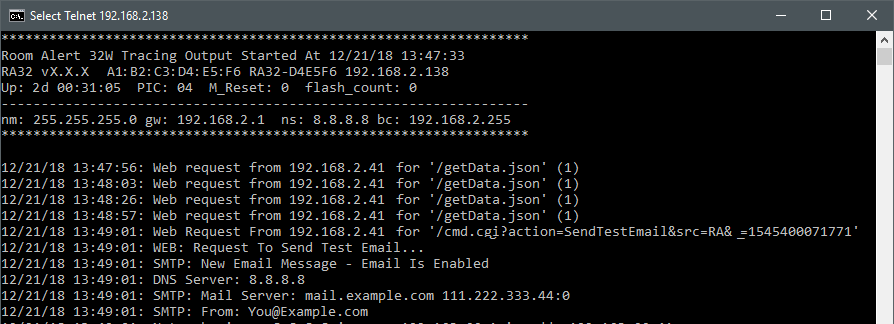
In the example shown below, the IP address of the Room Alert is 192.168.2.138; the trace port number is the default, 143.

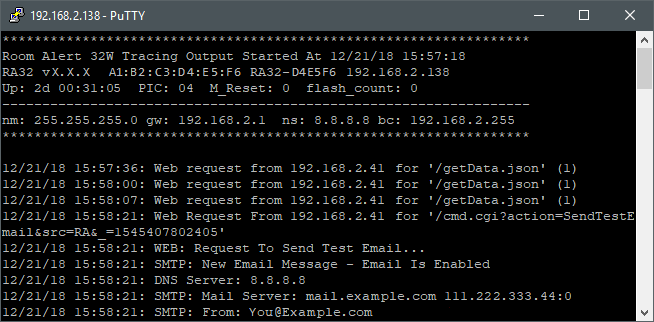
3. Once the trace starts, it is displayed live in Windows Command Prompt and also saved to a text file on your C:\ drive.
– The trace shown live in Windows Command Prompt:
– The trace saved to a txt file in your C:\ drive:
4. Next, go to Step 3 to recreate the issue you’re experiencing.
To capture a trace using MAC Terminal, please follow these instructions:
* These instructions require Telnet, which may not be available on newer versions of system software (including macOS Mojave and macOS High Sierra).
1. First, open a Terminal window.
– Press Command + Space on your keyboard to use Spotlight. Then type “terminal” and select Terminal from the list of programs.
2. At the prompt, enter the following command:
telnet <IP address of your Room Alert unit> <trace port number>
In the example shown below, the IP address of the Room Alert is 192.168.2.138; the trace port number is the default, 143.
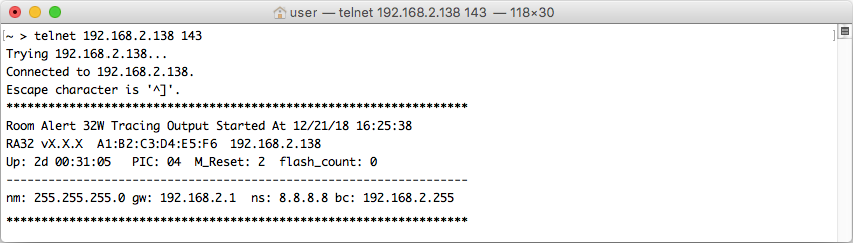
3. Once the trace starts, it is displayed live in the window.
4. Next, go to Step 3 to recreate the issue you’re experiencing.
You may download PuTTY, a terminal emulator program, free from the Internet.
You must have Telnet enabled on your Windows system in order to complete the steps below. Telnet is disabled by default in Windows versions Vista and above. Please see our FAQ How To Enable Telnet In Windows (Versions Vista And Above) for help.
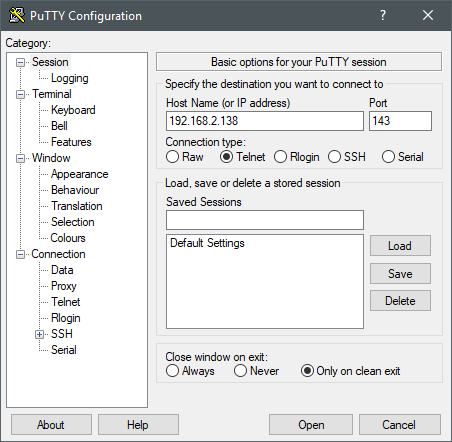
1. Open PuTTY. You must run it as an administrator to save the trace to a file on your C:\ drive.
2. Select Session in the navigation bar to the left.
3. In Host Name, enter the IP address of your Room Alert Monitor.
In the example shown below, the IP address of the Room Alert is 192.168.2.138.
4. In Port, enter 143 or the port you configured for trace on your Room Alert Monitor. (143 is the default.)
5. In Connection Type, select Telnet.
6. Next, select Logging (under Session) in the navigation bar to the left.
7. In Session Logging, select All session output.
8. In Log file name, erase what is there and enter “C:\tracefile.txt.”
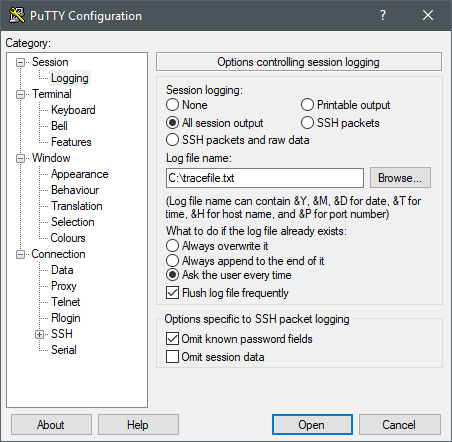
9. Then select Open at the bottom of the screen to begin the trace.
– Once it starts, it’s displayed in the PuTTY window and saved to a text file on your C:\ drive.
10. Next, go to Step 3 to recreate the issue you’re experiencing.
We'd love to talk with you about your monitoring needs. Contact one of our Product Specialists for a free consultation.


You may find Windows Command Prompt at the following path:
To run Windows Command Prompt as an administrator:
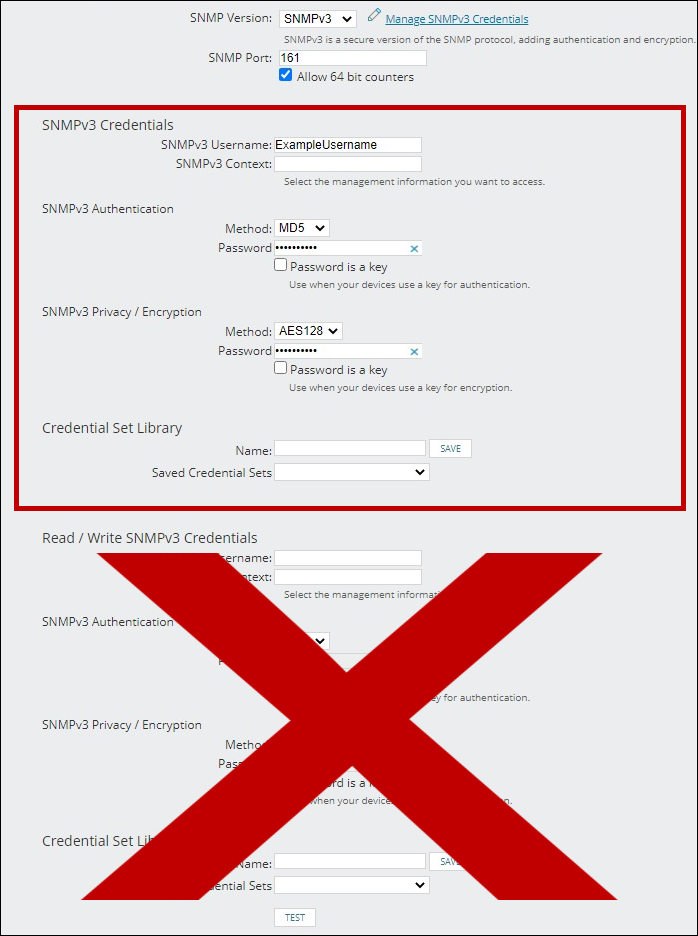
If you are using this client, you should configure the general SNMPv3 Credentials, but leave the Read / Write SNMPv3 Credentials section blank.
| Current S models | Current E models |
|---|---|
| Room Alert 32S | Room Alert 32E |
| Room Alert 12S | Room Alert 12E |
| Room Alert 3S | Room Alert 4E |
| Room Alert 3E | |
| S models | E & W models |
|---|---|
| Room Alert 32S | Room Alert 32E |
| Room Alert 12S | Room Alert 12E |
| Room Alert 3S | Room Alert 4E |
| Room Alert 3E | |
| Room Alert 3W |
| Model |
|---|
| Room Alert MAX |
| Room Alert 32S |
| Room Alert 12S |
| Room Alert 3S |
| Room Alert 32E/W |
| Room Alert 12E |
| Room Alert 4E |
| Room Alert 3E |
| Room Alert 3 Wi-Fi |