Knowledge Base / Frequently Asked Questions / Device ManageR (Legacy)
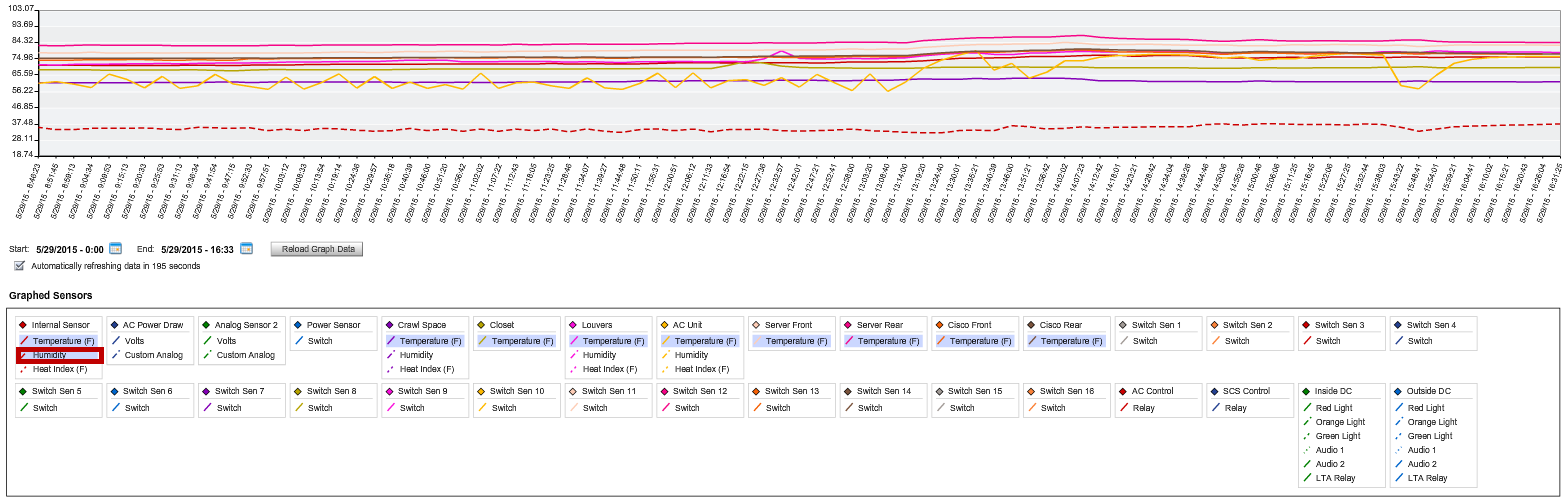
Device ManageR automatically logs current sensor values of all found devices to a database. Using the logged sensor values, Device ManageR allows users to view real-time graphs of sensor data over multiple date and time ranges. The graphs can serve as a useful tool in identifying trends in power or cooling, as well as potential trouble spots in the data center environment.
1. Open Device ManageR in your web browser. You may open it by entering ‘localhost:8080’ or ‘<IP address of host system>:8080’ in your browser’s address bar.
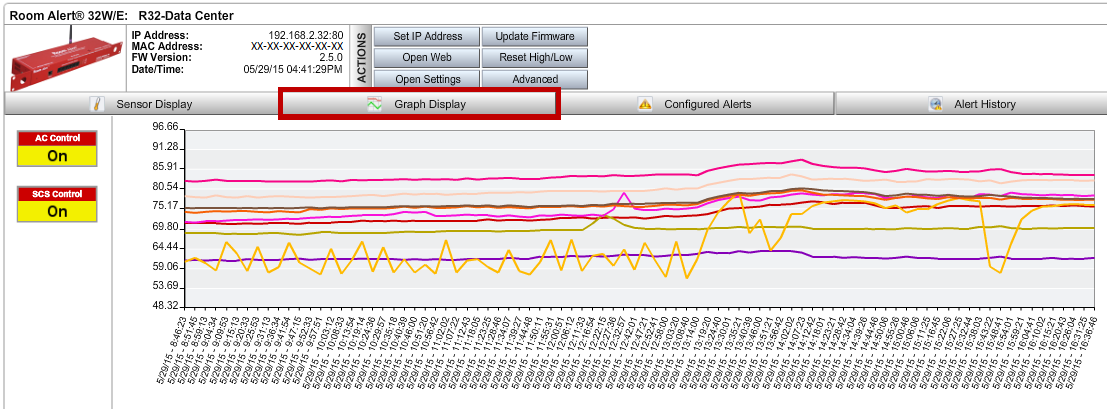
2. Select the device you wish to view from the Discovered Devices list to the left of the screen.
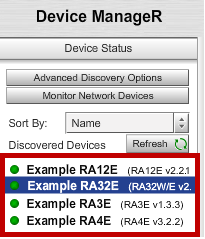
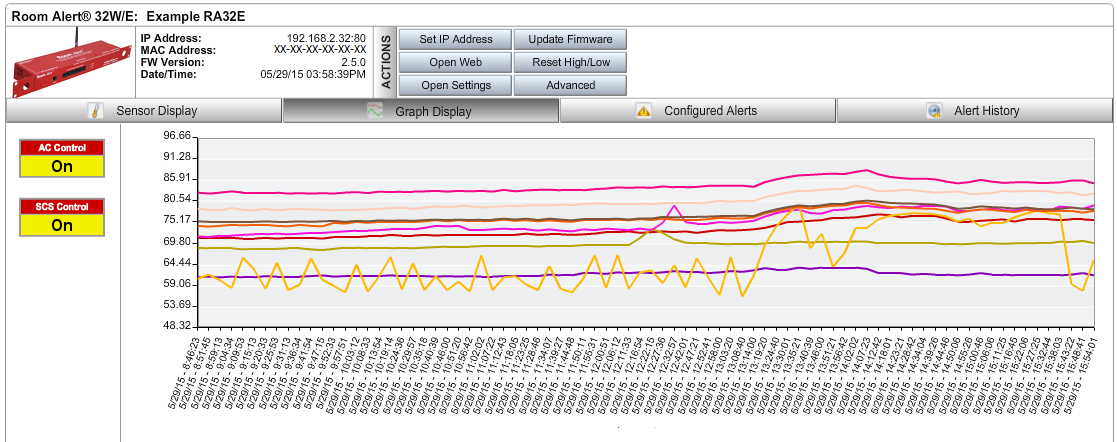
3. Select Graph Display from the four tabs that appear in the main viewing pane to the right. The default graph, which displays your Room Alert’s temperature values from today’s date, will appear.
– On the y-axis (left vertical side) appears the range of values graphed.
– On the x-axis (bottom horizontal side) appears the time range graphed.
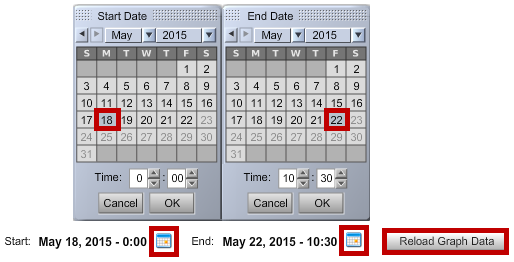
1. Select the Start and End calendar icons.
2. Enter your custom dates and times in the calendars that appear.
3. Select OK.
4. Then select Reload Graph Data to update the graph.
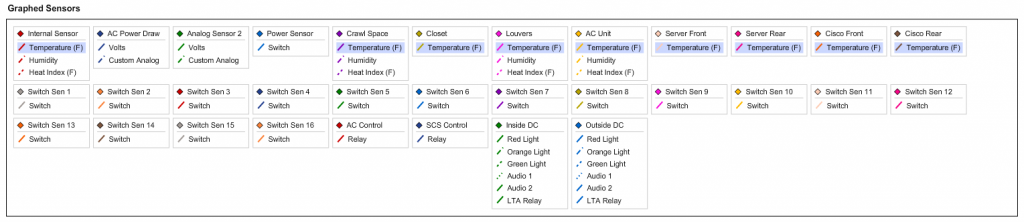
Below the graph is the Graphed Sensors section, which functions as the legend for the graphed data. The currently-displayed sensors are highlighted in blue. The default graph has your Room Alert’s temperature values highlighted and displayed. You may add or remove sensors from the graph as you wish.
1. Select or de-select the sensor type below the sensor label.
2. The new sensor will automatically display on the graph.
3. The range of values on the y-axis will automatically update if necessary to display the new values.
We'd love to talk with you about your monitoring needs. Contact one of our Product Specialists for a free consultation.


You may find Windows Command Prompt at the following path:
To run Windows Command Prompt as an administrator:
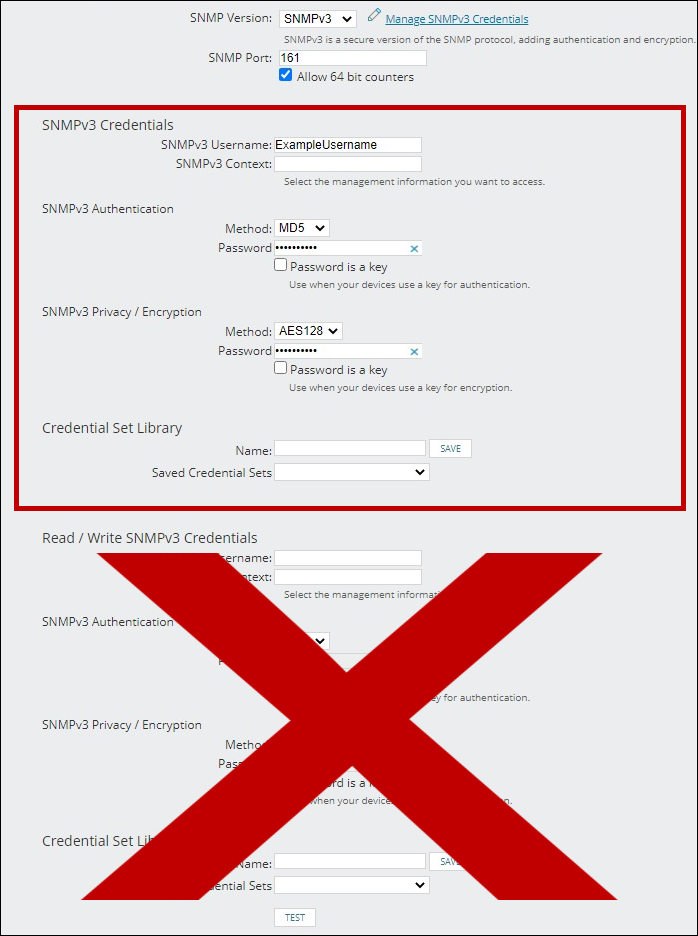
If you are using this client, you should configure the general SNMPv3 Credentials, but leave the Read / Write SNMPv3 Credentials section blank.
| Current S models | Current E models |
|---|---|
| Room Alert 32S | Room Alert 32E |
| Room Alert 12S | Room Alert 12E |
| Room Alert 3S | Room Alert 4E |
| Room Alert 3E | |
| S models | E & W models |
|---|---|
| Room Alert 32S | Room Alert 32E |
| Room Alert 12S | Room Alert 12E |
| Room Alert 3S | Room Alert 4E |
| Room Alert 3E | |
| Room Alert 3W |
| Model |
|---|
| Room Alert MAX |
| Room Alert 32S |
| Room Alert 12S |
| Room Alert 3S |
| Room Alert 32E/W |
| Room Alert 12E |
| Room Alert 4E |
| Room Alert 3E |
| Room Alert 3 Wi-Fi |