Knowledge Base / Frequently Asked Questions / Room Alert Account (RoomAlert.com)
The Dashboard in your Room Alert Account gives you an at-a-glance view of the information that matters most to you.
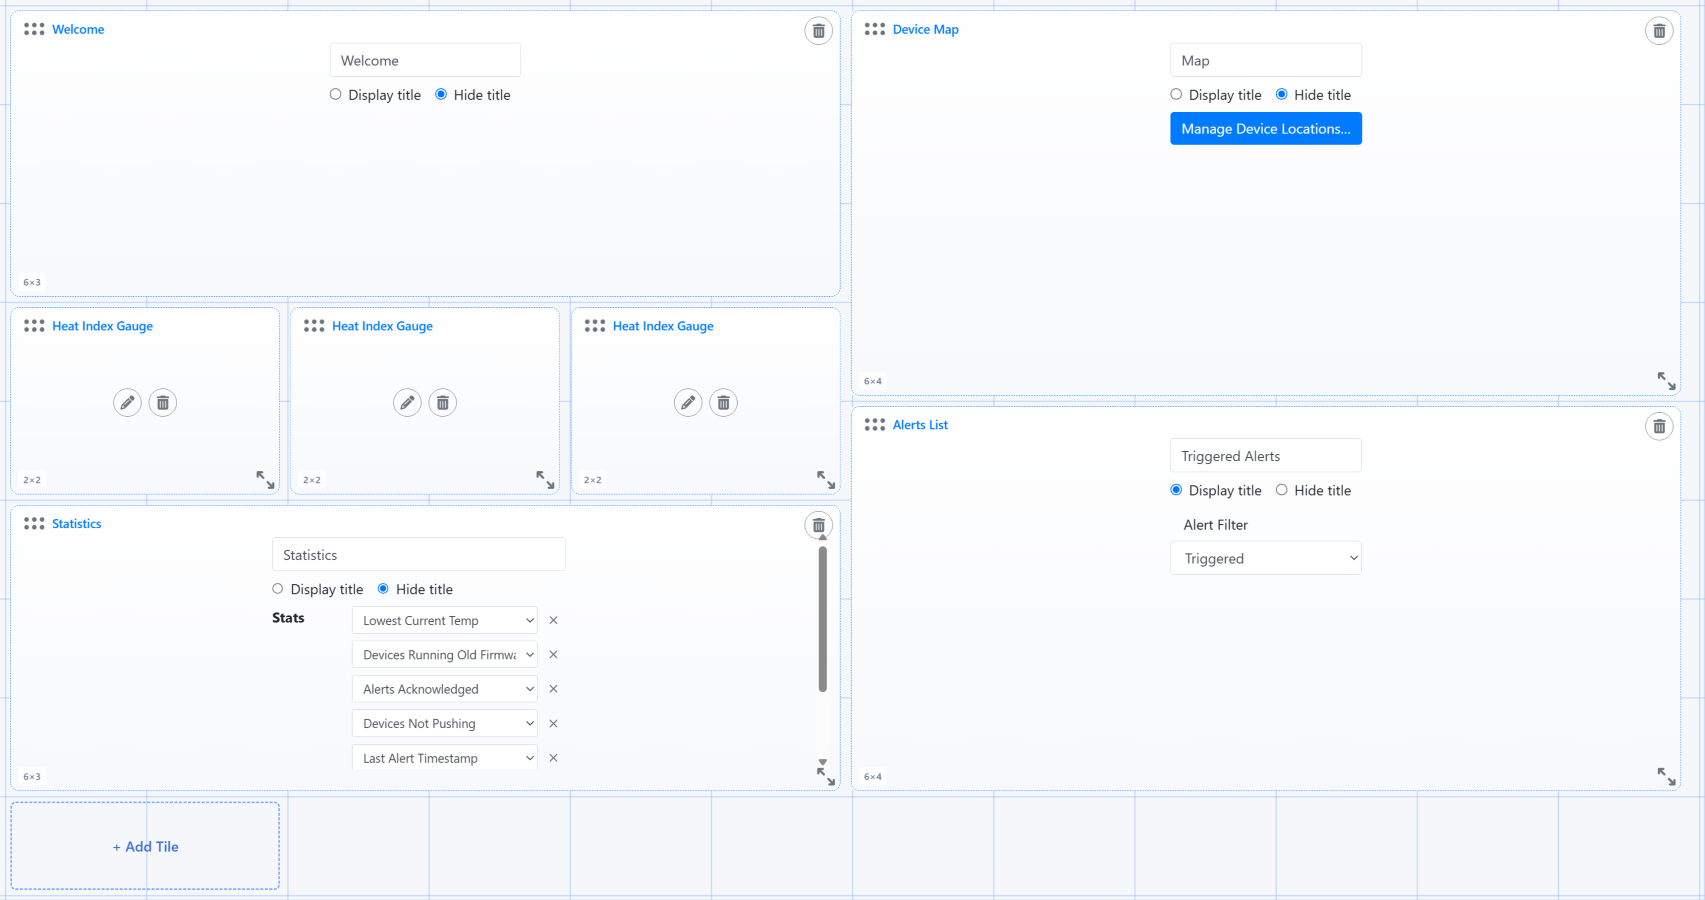
You may customize your Dashboard by adding tiles for individual sensor readings, sensor statistics, heat index gauges, graphs, maps, data tables, alert history and more. You may also drag and drop your tiles into different positions and resize them to create a layout that works best for you.
Follow these steps to customize your Dashboard:

Your tiles will now appear in the positions and sizes you selected.
To add information to your Dashboard:
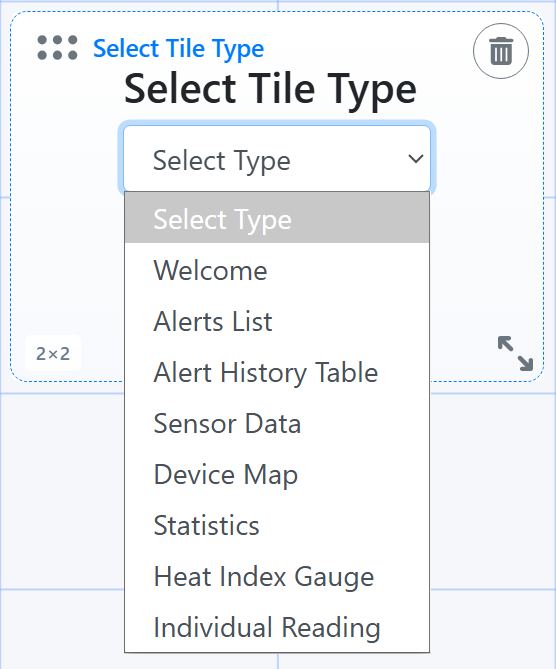
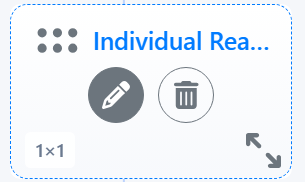
You may add multiple tiles of the same type. For example, you may add individual sensor-reading for several important temperature sensors so that you can view all of their current readings at once.
Different tiles are useful for different types of information. You may combine them to create a Dashboard focused on the devices, sensors and conditions that are most important to you.
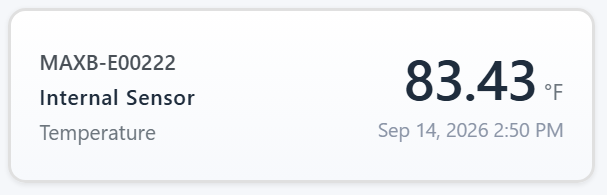
The Sensor Reading tile focuses on an individual sensor and its current reading.
Use this widget when you want a particular sensor to be easy to monitor at a glance—for example, the temperature in a server room, humidity in a storage area or the status of a flood sensor.
When configuring the widget, select the sensor whose current data you wish to display. You may choose to display the timestamp of the latest data reading if you’d like.
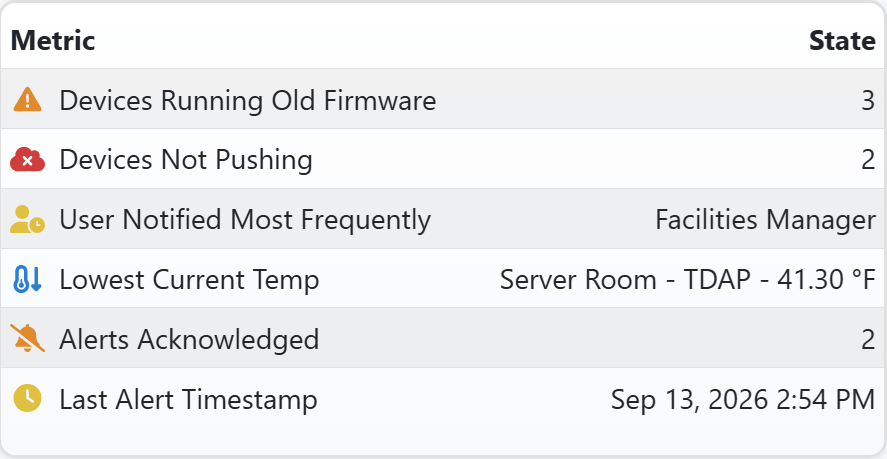
The Statistics tile provides a quick summary of key device, sensor, and alert information across your Room Alert Account.
Select the statistics that are most useful to you to create an at-a-glance summary of the overall status of your account.
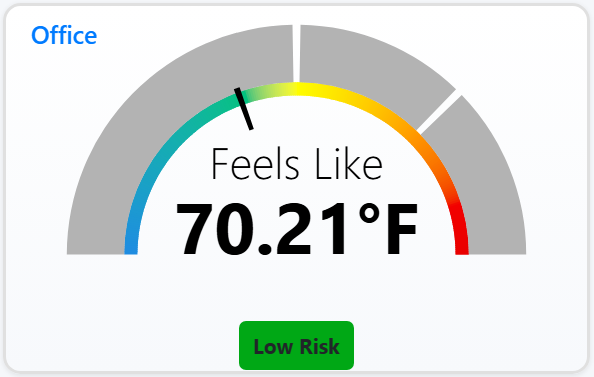
The Heat Index Gauge provides a visual representation of heat index conditions.
Heat index takes both temperature and relative humidity into account to represent how hot conditions feel. The gauge makes it easier to quickly identify the severity of the current conditions without needing to interpret the temperature and humidity readings separately.
This tile can be particularly useful for facilities where heat exposure is a concern, such as warehouses, production areas or other occupied spaces.
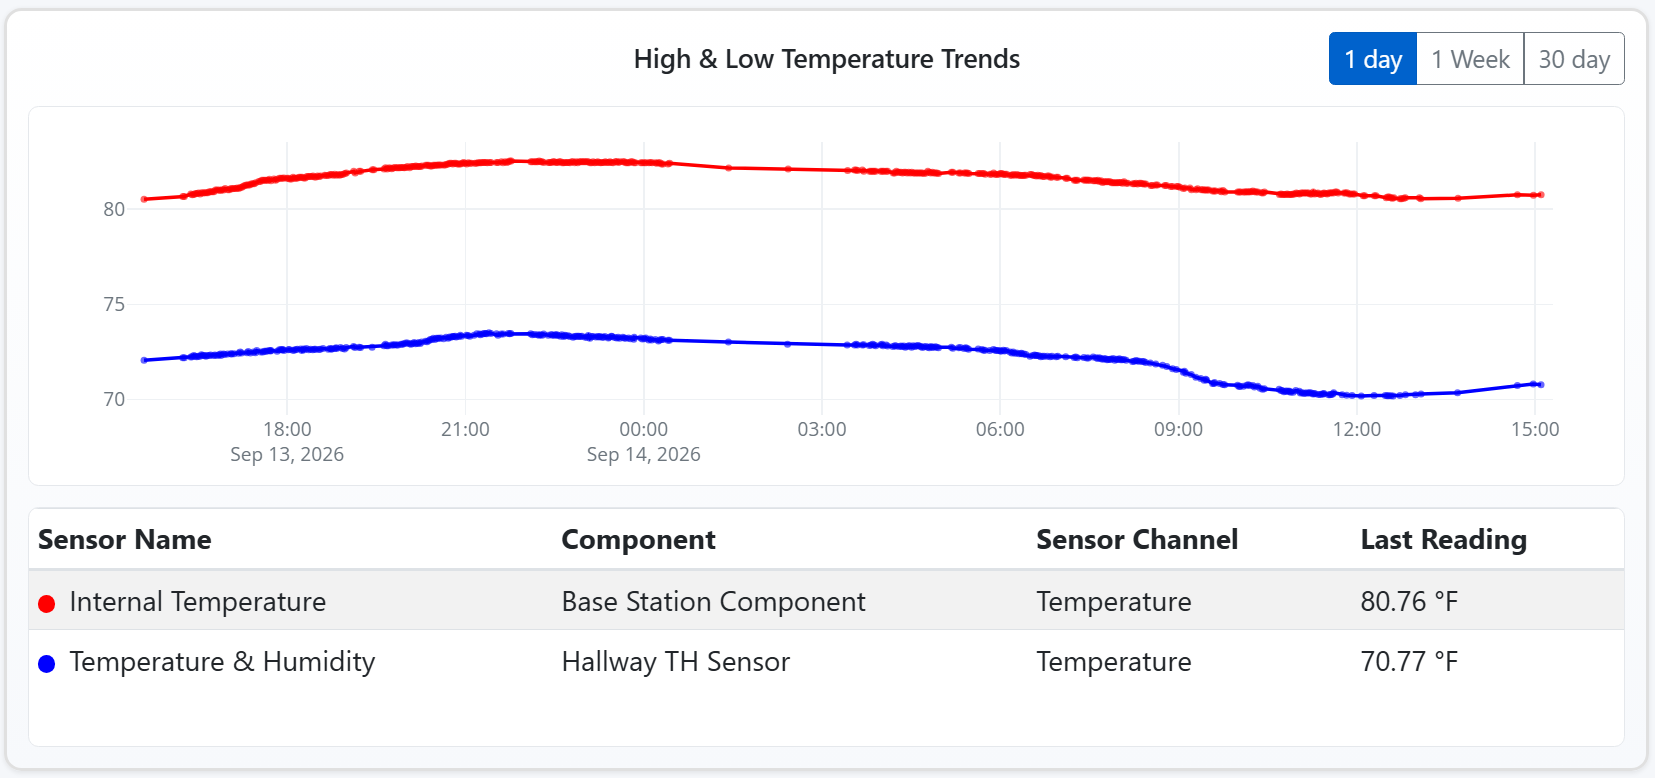
The Sensor Data tile allows you to visualize sensor readings over time directly on your Dashboard.
You can choose to display either a table of sensor readings, graphed sensor data, or both. Configure the graph by selecting the sensor data you wish to monitor and the applicable time period.
For example, you could use a graph to:
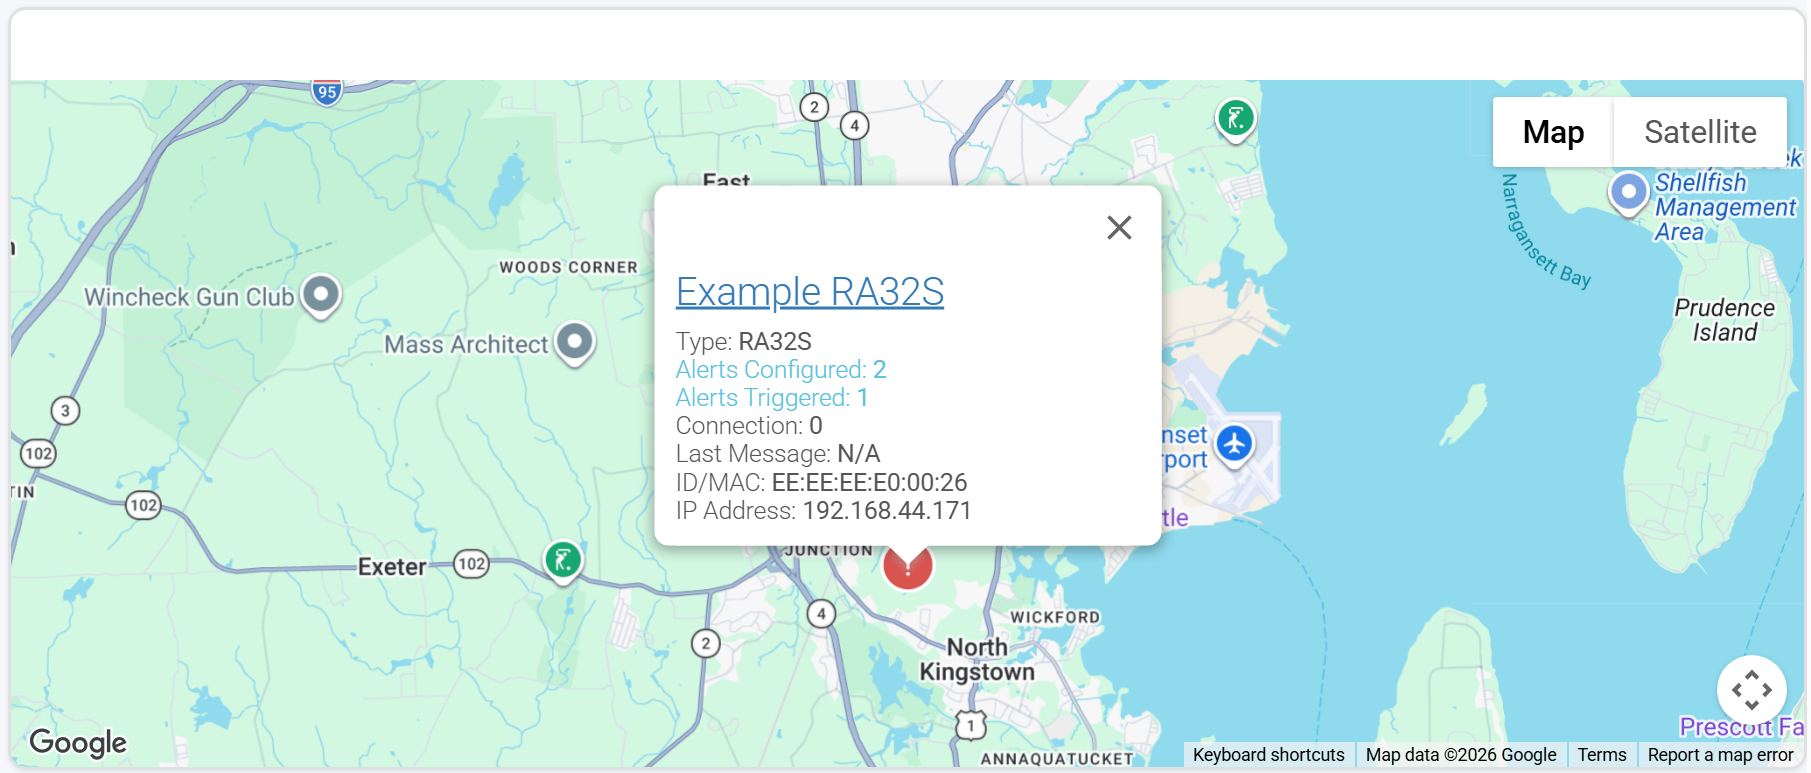
The Map widget displays the locations of your Room Alert devices on a map.
This is useful for accounts containing monitors at multiple buildings, facilities or geographic locations because it provides a visual overview of where your devices are located.
Your devices must have location information configured in order to appear in the appropriate locations on the map.
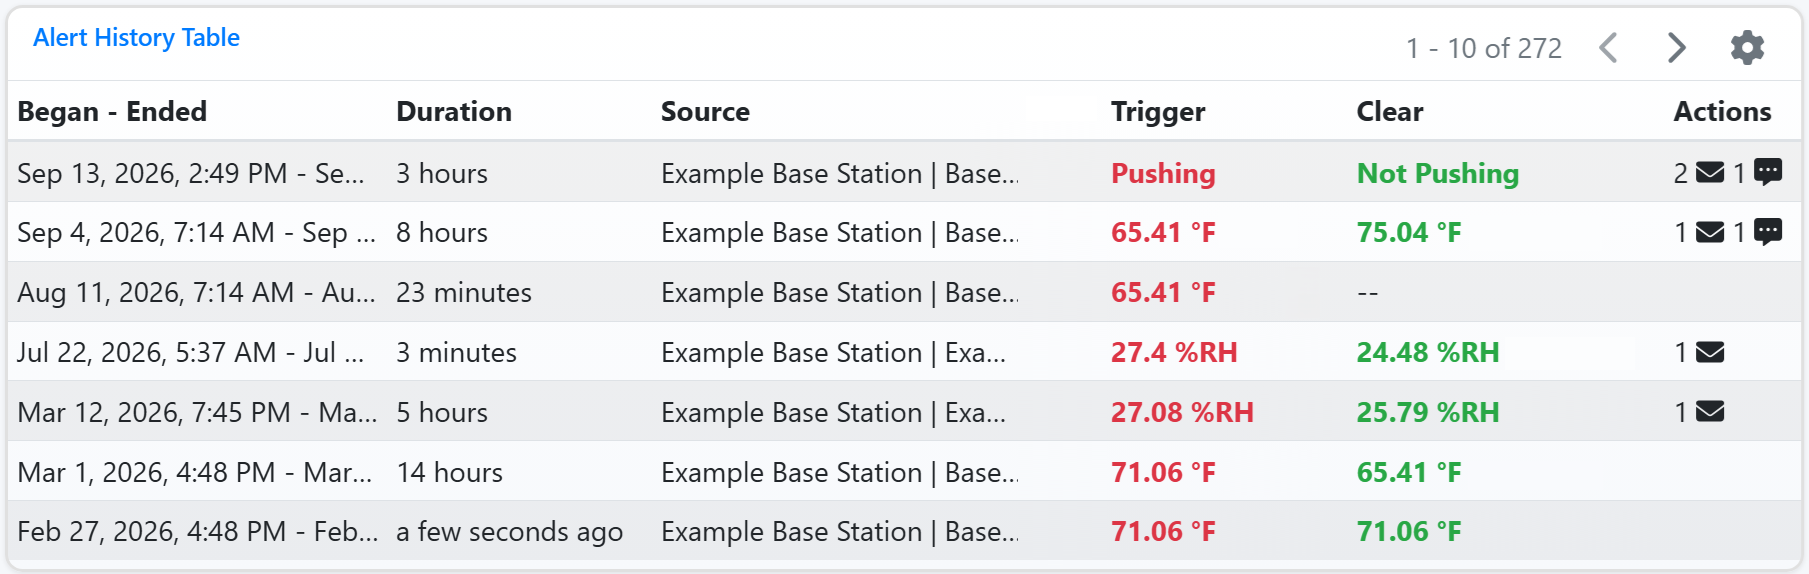
The Alert History tile provides a quick view of recent alert activity from your Dashboard.
Use this tile when you want to keep recent environmental events visible alongside your live sensor information.
While your Dashboard is in edit mode, you may rearrange its layout at any time.
To move a tile, select the grip dots icon in the upper right corner and drag it to the desired location. The surrounding tiles will adjust as you reorganize the Dashboard.
To resize a tile, use its resize control and drag until the tile is the desired size. Some tiles are locked to certain sizes or ratios.
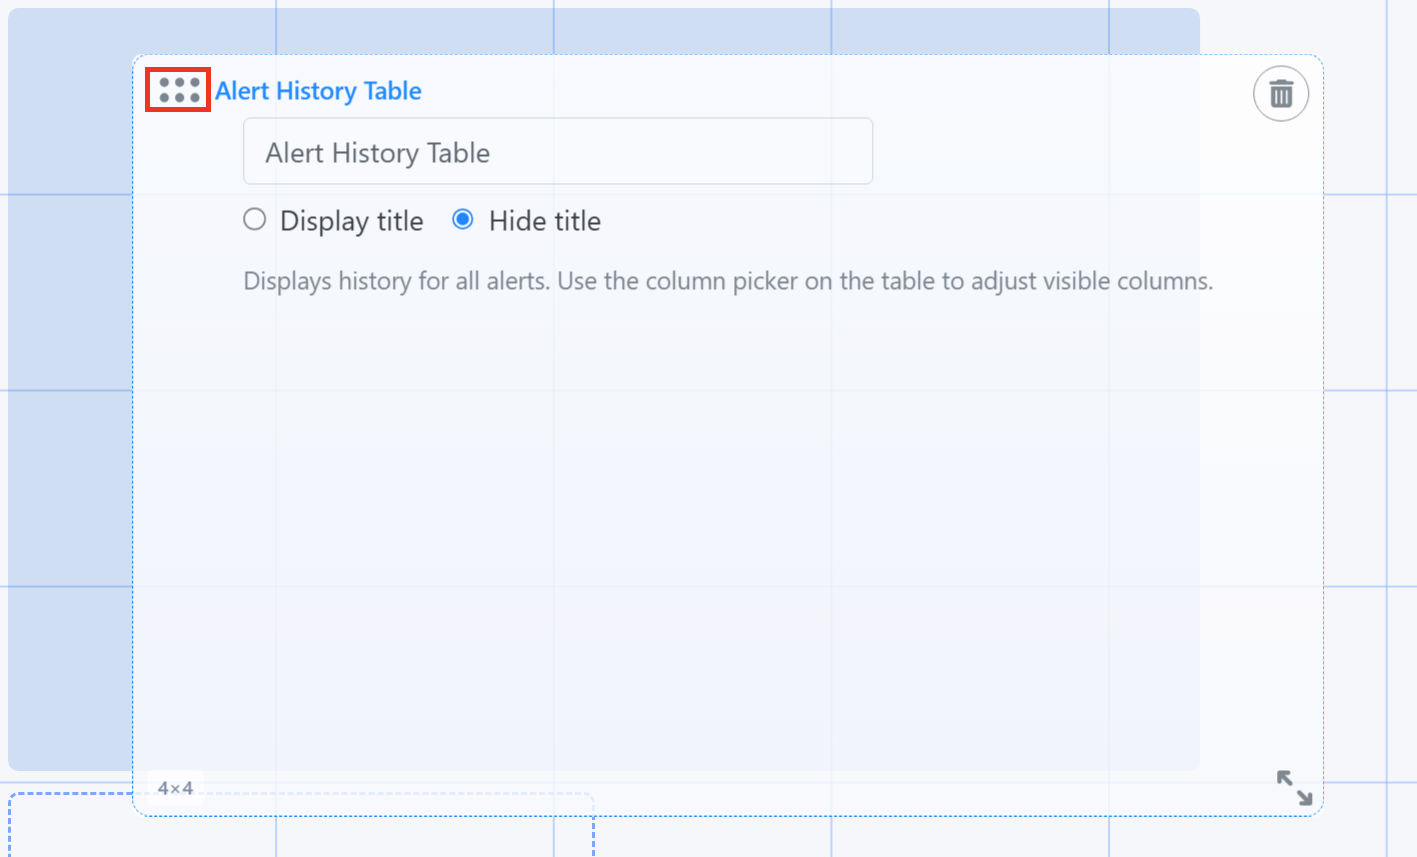
Different tile sizes may work better for different information. For example, an individual sensor reading may require relatively little space, while a graph, map or data table may benefit from a larger area.
When you’re satisfied with your layout, save your changes to return to the normal Dashboard view.


We'd love to talk with you about your monitoring needs. Contact one of our Product Specialists for a free consultation.


You may find Windows Command Prompt at the following path:
To run Windows Command Prompt as an administrator:
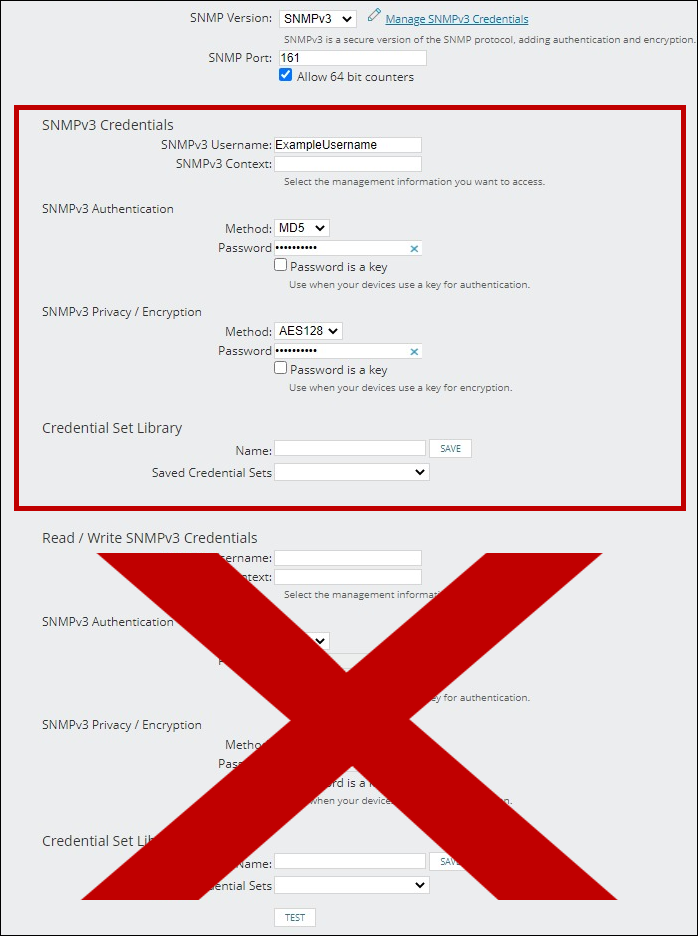
If you are using this client, you should configure the general SNMPv3 Credentials, but leave the Read / Write SNMPv3 Credentials section blank.

| Current S models | Current E models |
|---|---|
| Room Alert 32S | Room Alert 32E |
| Room Alert 12S | Room Alert 12E |
| Room Alert 3S | Room Alert 4E |
| Room Alert 3E | |
| S models | E & W models |
|---|---|
| Room Alert 32S | Room Alert 32E |
| Room Alert 12S | Room Alert 12E |
| Room Alert 3S | Room Alert 4E |
| Room Alert 3E | |
| Room Alert 3W |
| Model |
|---|
| Room Alert MAX |
| Room Alert 32S |
| Room Alert 12S |
| Room Alert 3S |
| Room Alert 32E/W |
| Room Alert 12E |
| Room Alert 4E |
| Room Alert 3E |
| Room Alert 3 Wi-Fi |