Knowledge Base / News
Since the launch of Room Alert Manager in 2020, our team has continued to invest significant engineering efforts into adding features that help users further prevent costly environmental downtime. Room Alert Manager is the most user-friendly and highly secure tool for the management of Room Alert monitors, sensors and accessories. Now with sensor data and reporting, we’re taking proactive environmental monitoring to the next level.
Previously in Room Alert Manager, users had access to a “Reports” tab. Under the “Reports” tab, users could easily graph the data being collected by their Room Alert sensors in order to see an organized overview of the conditions in their facilities. Our reporting features have always been well-received by customers, so we decided to enhance it with additional resources. This tab is now called “Sensor Data and Reporting” and has the subcategories “Explore” and “Data Groups”. On this page, you can
Sensor Data and Reporting features have significantly enhanced the ability for Room Alert Manager to provide even more comprehensive environment monitoring capabilities.
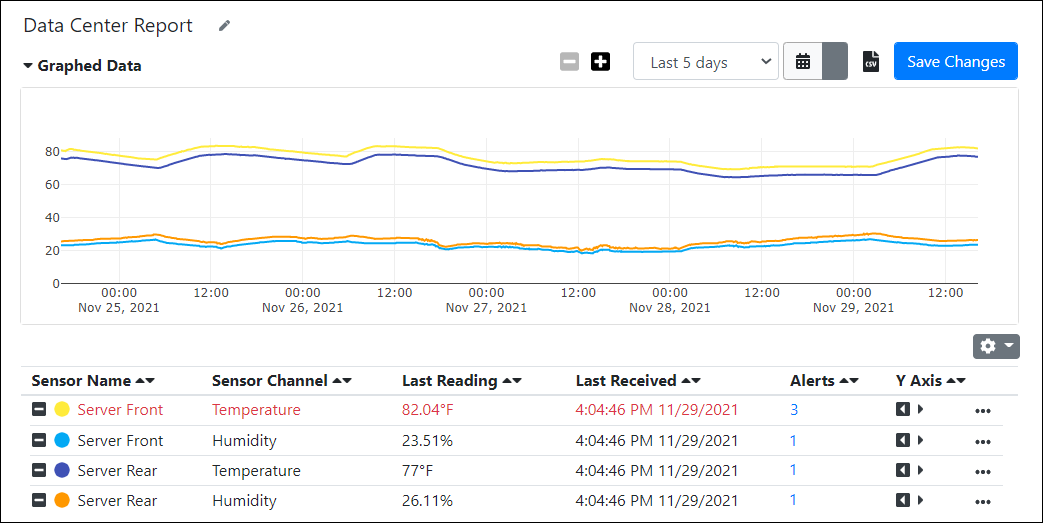
When users first open “Sensor Data and Reporting”, an “Explore Data” page will appear. In the “Graphed Data” section of this tab, you’ll be able to create graphs, just like before, however you’ll also be able to explore extensive information regarding all of your Room Alert sensors.
To populate your graph, you can add sensors from the “Explore Sensor Data” section at the bottom of the page. This is where you will find a complete list of all of the sensors that Room Alert has recorded. By clicking the + next to the sensor name, it will get pushed up the page and reflect on the graph above. To filter the information in your list of sensors, you can click the Gear icon. Here you can customize and organize the details displayed such as number of alerts associated with that channel, device type, serial number, MAC address and more. You can also change the Y axis on your graph, making graphing fully customizable to meet your exact needs.
Once you configure your graph to include as many sensors as you’d like, you can utilize a lot of the reporting features we previously had in reporting such as hovering over a sensor to get a quick reading, zooming in and moving in a zoomed view, and downloading graphs as a CSV file. Now, users can also change the size of their graph to best suit their sensor data.
At the bottom of this page is a comprehensive list of all of your sensors that Room Alert knows about, regardless of the device it is connected to. Any sensors that are presently in a triggered alarm state will appear in red and be pushed to the top of the list. Otherwise, the list will be organized alphabetically by default.
In your list of sensors, you’ll notice critical pieces of information about each sensor. This includes the sensor’s last reading, a timestamp of when that reading came from, the number of configured alerts associated with each sensor and more. You can click the Gear icon on the right hand size to customize the information you want visible.
The best part about the new “Sensor Data and Reporting” tab is how easy it is to find specific sensors. You can search your entire list of sensors by certain criteria such as sensor name, device or channel type. For example, if you’re trying to find a Digital Temperature & Humidity Sensor but you aren’t sure where it is, you can search “Humidity” under channel type. Or say you’re trying to find a sensor that is connected to a Room Alert 32S, you can search by the type of device. Or maybe you aren’t sure of the type of sensor or device it is connected to, but you do know it is named after a freezer location. You can search by sensor name by typing keywords such as “Freezer”. These search bars work both independently and together to help you search through even the longest of sensor lists and easily find whatever sensor you are looking for, without having to scroll through hundreds or even thousands of sensors manually.

There are two options for saving graphed data. Users can “Create an alert from all graphed channels” or “Save as a Data Group”. If you click “Create an alert from all graphed channels” then you will be brought to a form to create an alert. This form will automatically be partially filled out based on all of the data in your graph. You will just have to input the exact condition(s) you want to alert to, such as a specific temperature. If you only want to create an alert on one channel on your graph, then you can click the 3 dots next to that particular sensor and it will automatically populate the alert form for that single sensor. Our team designed this feature in direct response to feedback from customers. With the new “Create an alert from all graphed channels” option, customers are able to save a lot of time if they are trying to create multiple thresholds on an alert without having to manually fill out the entire alert form.
If you click “Save as a Data Group” then you are redirected to a “Data Groups” tab where you can see a quick view of all of your data groups. If any of your data groups are associated with a sensor that is in a triggered state, the name of the data group will be in red and pushed to the top of the list. In this default view, users can see a quick preview of each data group in a 24 hour view. Data groups can also be viewed in a list-view if you prefer to not see a quick view of your graphs. For additional information, you can click on any specific data group. There you can customize the title for that saved group. Under “Explore Sensor Data” you can review your comprehensive list of sensors and add any more sensors you’d like.
We are so excited to continue delivering advanced and secure features in Room Alert Manager. With the release of Sensor Data and Reporting, users will be able to use Room Alert Manager with more ease than ever before. From small businesses to larger scale facilities, Sensor Data and Reporting will allow customers to seamlessly manage their Room Alert hardware, whether they have just a few sensors and monitors or hundreds of thousands of units.
We'd love to talk with you about your monitoring needs. Contact one of our Product Specialists for a free consultation.


You may find Windows Command Prompt at the following path:
To run Windows Command Prompt as an administrator:
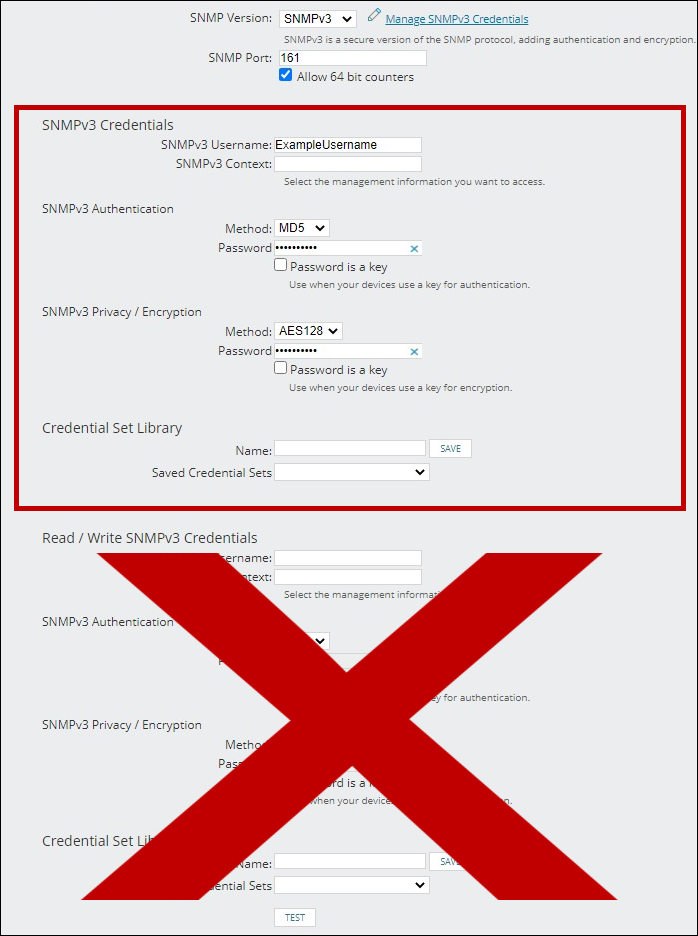
If you are using this client, you should configure the general SNMPv3 Credentials, but leave the Read / Write SNMPv3 Credentials section blank.
| Current S models | Current E models |
|---|---|
| Room Alert 32S | Room Alert 32E |
| Room Alert 12S | Room Alert 12E |
| Room Alert 3S | Room Alert 4E |
| Room Alert 3E | |
| S models | E & W models |
|---|---|
| Room Alert 32S | Room Alert 32E |
| Room Alert 12S | Room Alert 12E |
| Room Alert 3S | Room Alert 4E |
| Room Alert 3E | |
| Room Alert 3W |
| Model |
|---|
| Room Alert MAX |
| Room Alert 32S |
| Room Alert 12S |
| Room Alert 3S |
| Room Alert 32E/W |
| Room Alert 12E |
| Room Alert 4E |
| Room Alert 3E |
| Room Alert 3 Wi-Fi |