Support

Knowledge Base  /  Frequently Asked Questions  /  Room Alert Manager

How To Graph Your Room Alert Sensor Data

Whether you’re monitoring your Room Alert devices through your RoomAlert.com Account or through the Room Alert Manager software, the Sensor Data & Reports page includes features to:

  • Easily browse all of your sensors in one place.
  • View their current readings & alarm status.
  • Graph historic sensor data to visually track trends in your environment.

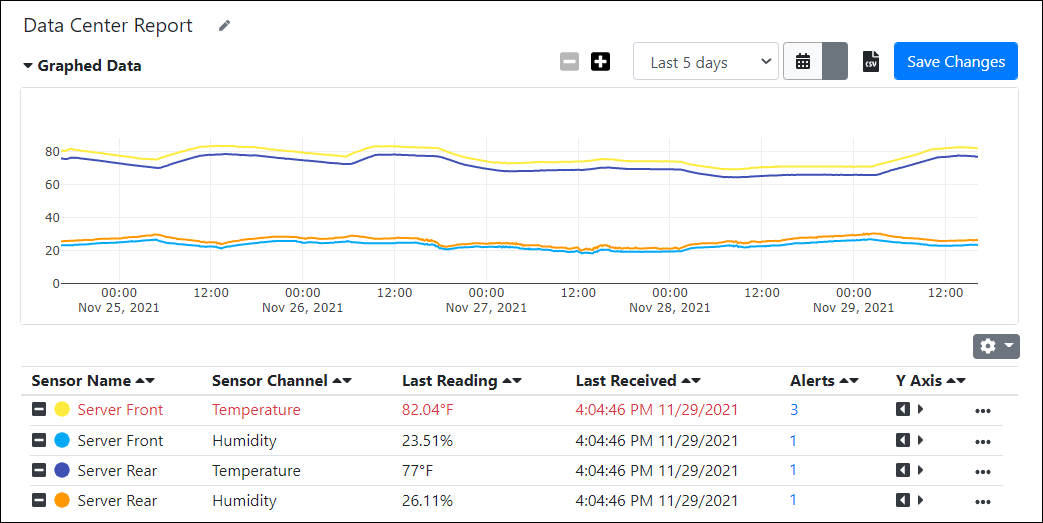
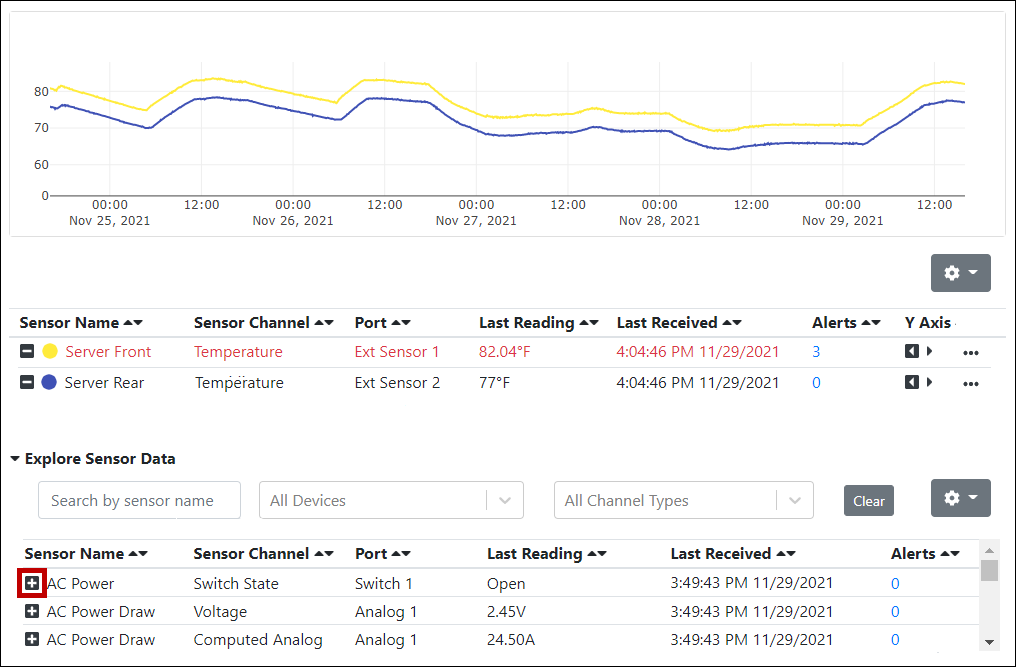
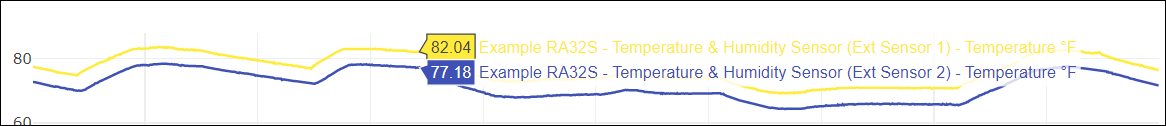
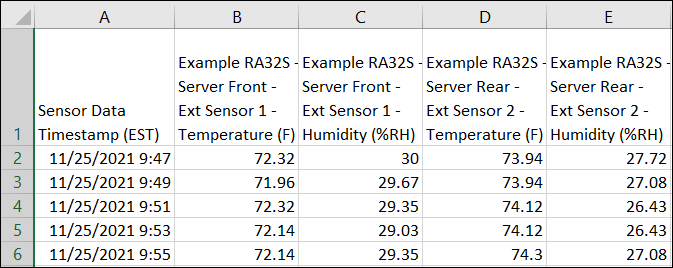
This example graph shows the temperature & humidity readings at the front and back of a server rack.

Please select the tabs below for step-by-step instructions to graph your sensor data, as well as information about interpreting and manipulating the graphed data.

Graph your sensor data

To begin graphing your sensor data, please follow the instructions below.

  1. Log in to your RoomAlert.com Account or Room Alert Manager.

Room Alert Account: For information about which users have access to view and edit graphs, please see the “Types of user roles” section of our FAQ, How To Manage User Access To Your RoomAlert.com Account.

Room Alert Manager: All users can graph sensor data from any devices they have access to; however, certain features are restricted to admin-level or manager-level users. For more information, please see the “Types of user roles” section of our FAQ, How To Configure Users In Room Alert Manager.

  1. Select Sensor Data and Reports in the navigation bar to the left.
  2. This will open the Explore Data page, where you may browse all of your sensors, view their current readings, and graph their historic data.
  3. This page is made up of two collapsible sections: Graphed Data and Explore Sensor Data. 
    • The graph is blank until you begin selecting channels to graph.
  4. Scroll to the Explore Sensor Data section of the page.

    Here, you’ll find a table containing every sensor channel from all available devices.
    • If a sensor channel is currently associated with one or more triggered alert(s), it gets listed in red.
  5. To locate sensors in the table, you may use any combination of the following:
    • Sort alphabetically by sensor name, numerically by total associated alerts, etc.

      (Tip: use the display cog button to display different columns in the table.)
    • Search by sensor name.
    • Filter by device or channel type.
  6. Select the  icon beside any channel to add it to the graph.

    The channel will then disappear from the Explore Sensor Data table, and get added to the Graph Legend table above. (Select the  icon beside any channel in the Graph Legend table to remove it.)
  7. Add as many channels to the graph as you’d like.
  8. Choose how much historical data you’d like to view in the graph.
    • In the time-range drop-down menu, you may leave the default (which is Last 6 hours in Room Alert Account, and Last hour in Room Alert Manager) or choose another time period.
    • In our example, we’re choosing Last 5 Days.
    • If you would prefer a specific date range, you may instead select the calendar icon and pick start and end dates. Select Apply to apply your date range.

In Room Alert Manager, the resolution of the data displayed in your graph is based on the size of the time period being represented. For more information, please see the Data resolution tab in this FAQ.

  1. Now that you’ve graphed your sensors, you may do the following:
  • Save your selections as a Data Group.
  • (Room Alert Manager only) Create an alert from all graphed channels.
    • To do so, select Create an alert from all graphed channels from the Select Action drop-down menu above the graph.
    • The New Alert form will open with all of your graphed channels already populated for you. Simply set a threshold for each sensor, and select/configure alert action(s) before saving your new alert. For more information, please see this FAQ: How To Create Alerts In Room Alert Manager.
  • Export the graphed sensor data to a CSV file.
View your sensor data

View information in the sensor channel tables…

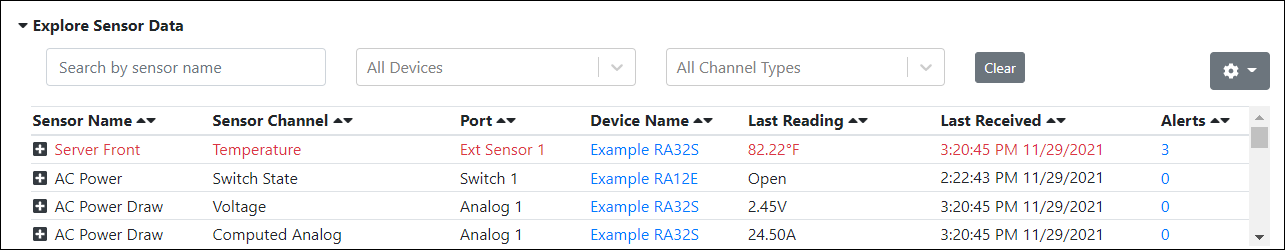
In both the Explore Sensor Data table and Graph Legend table, you may:

  • View the sensor channel’s latest reading
  • View a list of associated alerts
    • Select the number in the Alerts column.
    • This will open a window that lists all associated alerts.
  • Create new alert from channel

Make changes in the graph legend table…

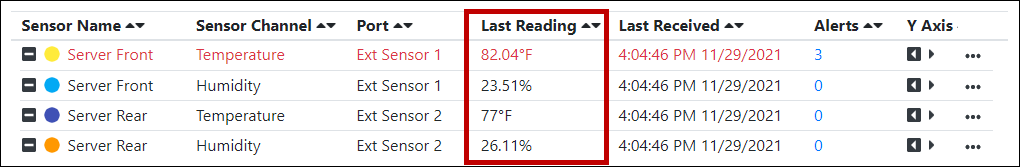
In the Graph Legend table, you may:

  • Change the color of sensor channels on your graph
  • Plot a sensor channel against a second y-axis

Manipulate the graph…

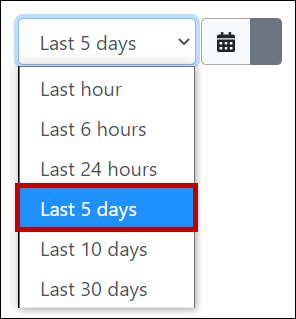
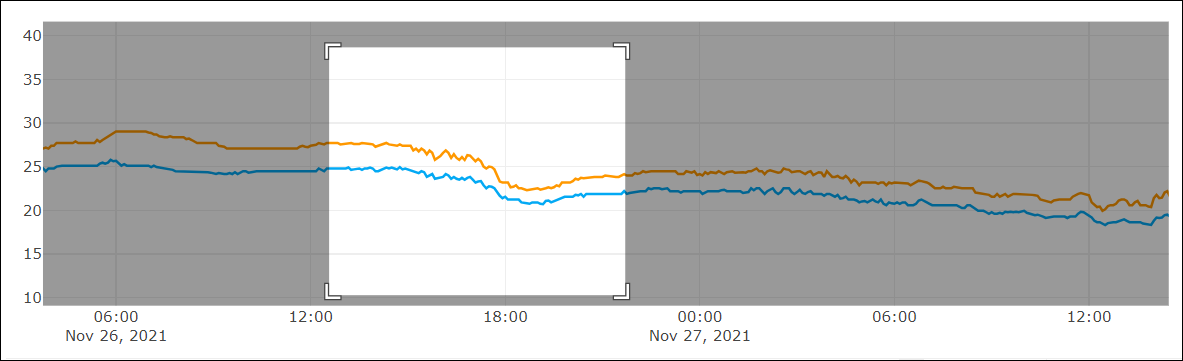
You may manipulate your graph by:

  • Increasing or decreasing the height of the graph
  • Hovering your mouse over the graph to view data points
  • Clicking on the graph and dragging your cursor to zoom in
Export your sensor data

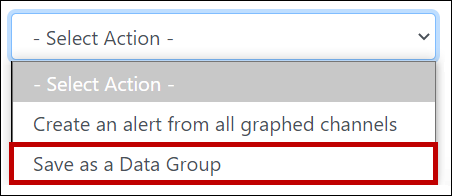
To export your graphed sensor data, please follow the instructions below.

  1. Select the CSV download icon above the graph.
  2. The senor data will download to a .csv document, which you may open with a spreadsheet program or text editor.
Room Alert Manager Data resolution

In Room Alert Manager, the resolution of the data displayed in your graph is determined by the selected time period.

If your graph’s time range is…then the data resolution is…
Less than 12 hoursFull resolution
Between 12 hours – 7 days5 minute resolution
Between 7 days – 90 days1 hour resolution
More than 90 days1 day resolution

We configured our example graph to include data from the last 5 days. Because this falls within the 12 hours – 7 days time range, our data resolution is 5 minutes.

  • This means that rather than displaying every single raw data point on the graph, Room Alert Manager calculates the average readings of data collected during 5 minute intervals.
  • Those averages make up the aggregated data, which is what’s plotted on the graph.

If you export your data, the downloaded CSV file will include all raw data points, not the aggregated data.

Facebooktwitterredditpinterestlinkedinmail
Room Alert is Made in the USA, ships worldwide from our locations in the US and EU, and has been protecting facilities since 1988.

You may find Windows Command Prompt at the following path:

  • Windows 7 & 8
    Start--> All Programs--> Accessories--> Command Prompt
  • Windows 10
    Start--> All Apps--> Windows System--> Command Prompt

To run Windows Command Prompt as an administrator:

  • Windows 7 & 8
    Right-click on Command Prompt and select Run as administrator.
  • Windows 10
    Right-click on Command Prompt, select More and then select Run as administrator.

Example Polling Method Properties saved in Orion SolarWinds:

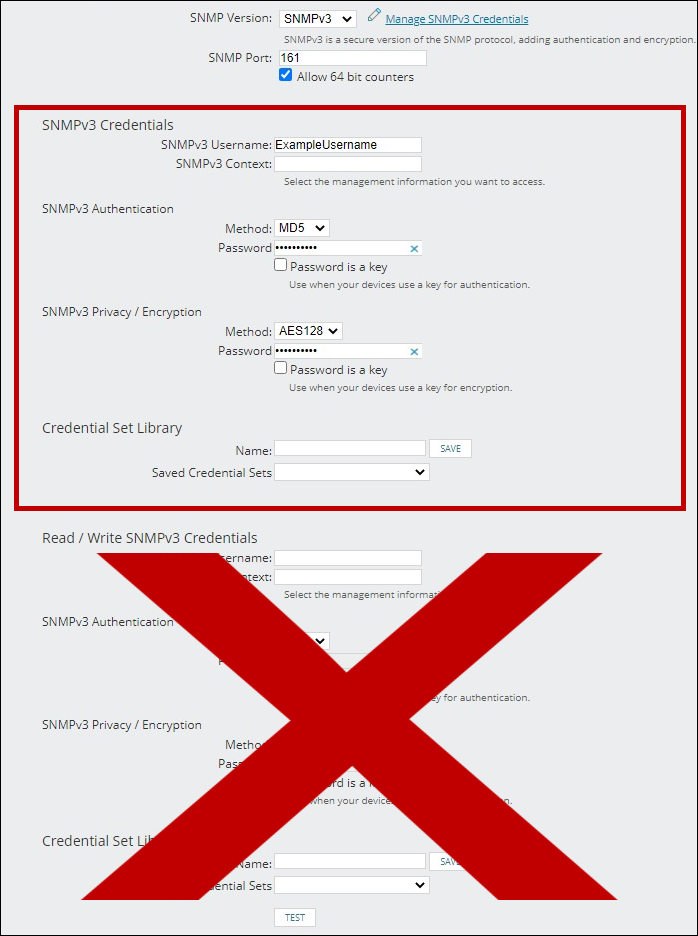
If you are using this client, you should configure the general SNMPv3 Credentials, but leave the Read / Write SNMPv3 Credentials section blank.

Room Alert Link- Supported Firmware Updates


Current S modelsCurrent E models
Room Alert 32SRoom Alert 32E
Room Alert 12SRoom Alert 12E
Room Alert 4E
Room Alert 3E

Room Alert Manager - Compatible Devices

The latest version of Room Alert Manager supports only the devices below.

It does not support any legacy Room Alert or TemPageR models.

Current S modelsCurrent E models
Room Alert 32SRoom Alert 32E
Room Alert 12SRoom Alert 12E
Room Alert 3SRoom Alert 4E
Room Alert 3E
Room Alert 3W